The trading P&L calendar that shows your month in one glance.
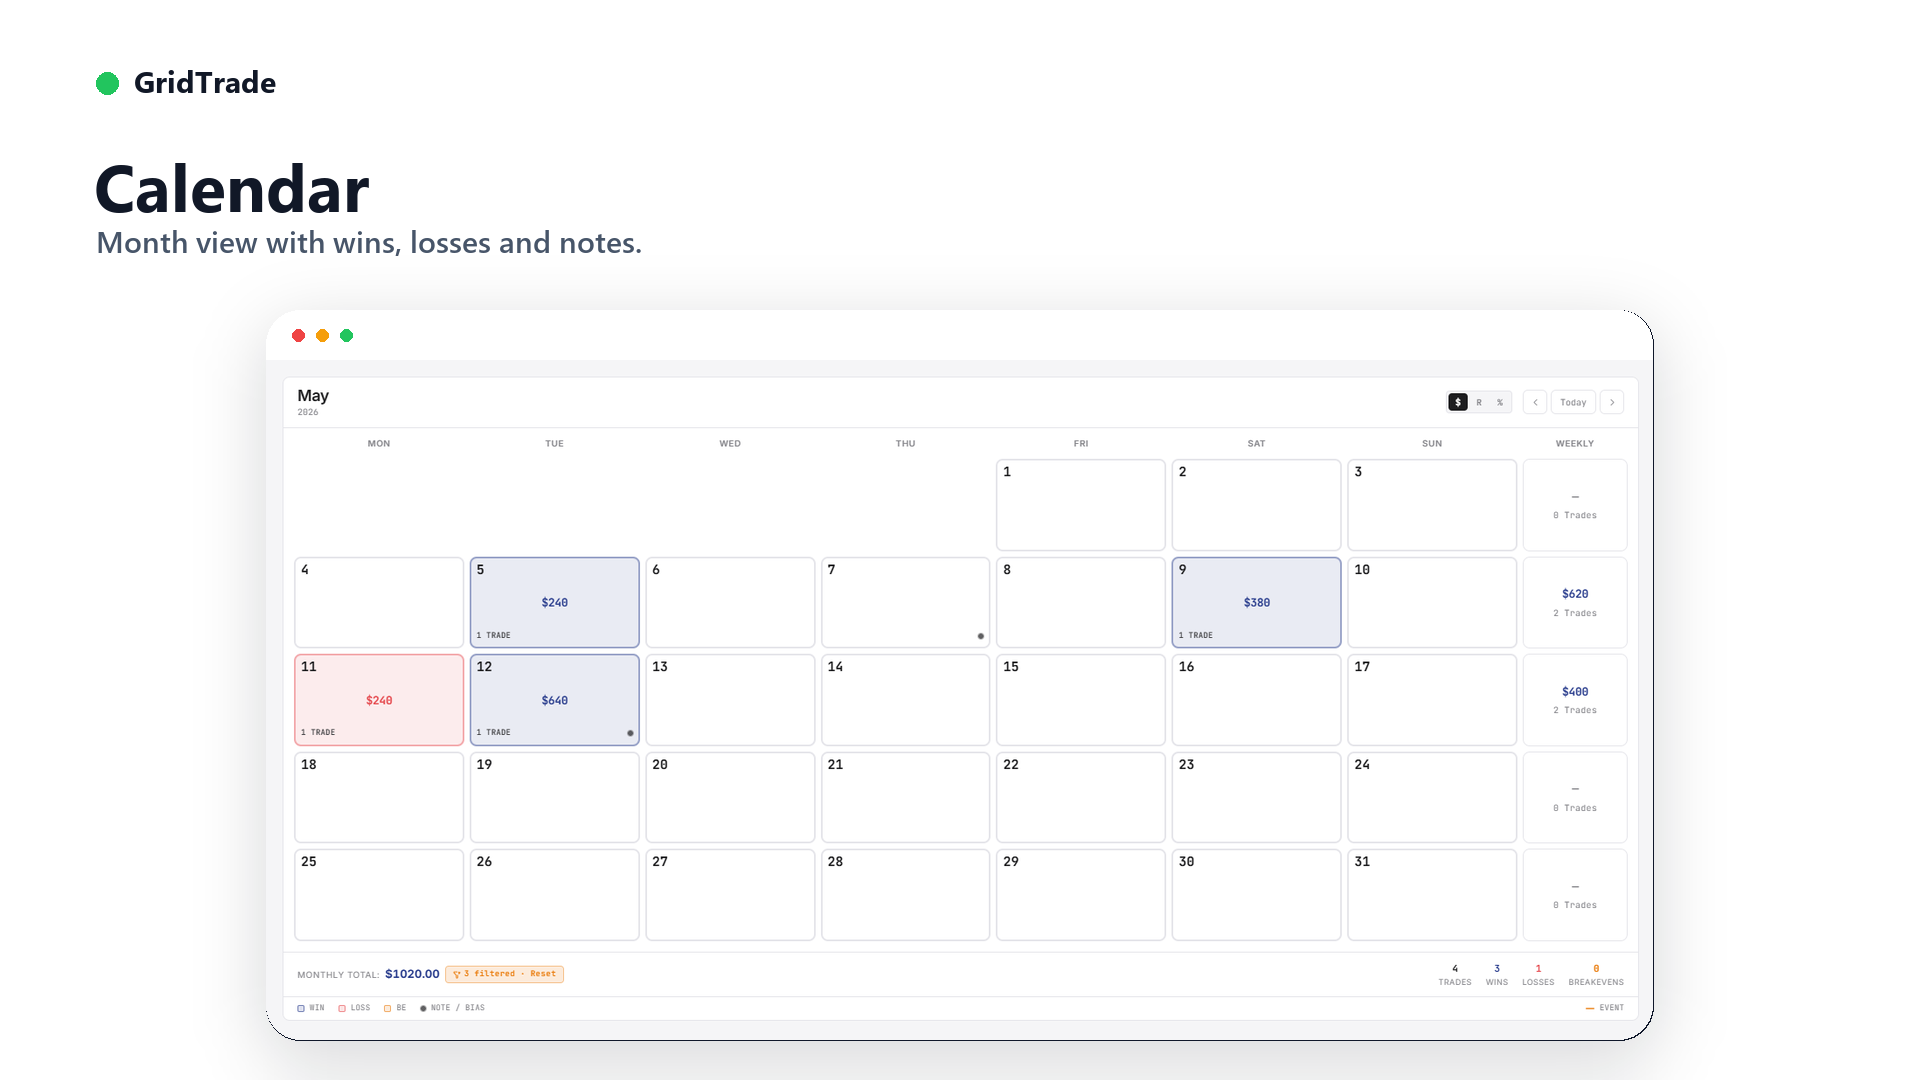
Every trading day is a green, red or grey box with the day's net P&L and trade count. Weeks sum in a column, the month sums at the top. Ten seconds of looking tells you what a spreadsheet takes an hour to reveal: your streaks, your red-day clusters, the one Thursday that blew the week, and whether your profit comes from steady days or a single outlier. GridTrade's calendar is built for exactly that review — and it filters by account, setup and emotion.
€24.99/mo after trial · no credit card · cancel anytime
5 things a P&L calendar shows you that a trade list can't
1. Daily boxes, weekly column, monthly total — the whole month in one grid
Each day shows net P&L, number of trades and the day's R. Grey means you sat out. The column on the right sums every week, the header sums the month. That is the entire review in one screen: no scrolling through a trade table, no exporting to a spreadsheet, no pivot tables. Open it after the session, read it in ten seconds, close it.
2. Red-day clusters and streaks become impossible to ignore
Three red boxes in a row look very different from three red days spread across a month, and only the calendar shows the difference. Clusters usually mean tilt — a loss on Monday that turned into revenge trading on Tuesday and oversizing on Wednesday. Seeing the streak on the grid is what makes traders finally build a rule for it, like a hard stop after two consecutive red days.
3. Steady days or one outlier? Consistency at a glance
A month that closes +€2,000 can be fifteen small green days or one +€3,500 Thursday plus a lot of bleeding. The first is a repeatable edge, the second is a lucky month. On the calendar the outlier day sits there as the single dark-green box, so you know which story you're in before you scale size — and before a prop firm's consistency rule tells you.
4. Weekday patterns: the Friday bleed, the Monday overtrade
Because the boxes are anchored to real dates, a column of red under "Fri" across three months is obvious. Many traders find one weekday that consistently loses — low-liquidity Fridays, news-heavy Wednesdays, or Mondays where they force trades after a weekend off. The calendar surfaces it; cutting that day is often the single largest improvement to monthly expectancy.
5. Switch the view between $, R-multiple and %
One toggle flips every box, weekly total and monthly sum between currency, R-multiple and percent of account. The R view is the honest one: it normalizes each day by the risk you took, so a month on a small account and a month on a funded account can be compared directly, and a big dollar day that was actually a sloppy +0.8R stops looking like a win.
How GridTrade's P&L calendar works
Filter it, click into it, and run it per account. The calendar is a view on your journal, not a separate feature you have to maintain:
Each funded, challenge or personal account gets its own calendar. Daily-loss-limit distance and the consistency rule become visible per account.
Show only your emotion-4+ days. For most traders that calendar is almost entirely red — the fastest way to quantify the tilt leak.
Turn the calendar into a per-playbook report: which days did the NQ open-drive or the EUR/USD London setup actually make money?
Any box opens the trades behind it with entry, exit, R, emotion and notes — from the pattern to the individual decision in one click. Works for futures, forex and stocks.
FAQ — trading P&L calendars
A P&L calendar is a month-grid view of your trading results where every trading day is a colored box: green for a net profitable day, red for a net losing day, and grey for days you did not trade. Each box shows the day's net profit or loss, the number of trades taken, and often the day's R-multiple or percentage return, while a column at the right edge sums each week and a header sums the month. The point is speed. A table of trades tells you what happened one row at a time; a calendar tells you how the month went in a single glance, including streaks, clusters of red days, and the one outlier day that made or ruined the week. Most traders keep it open next to their journal because it turns hundreds of trades into a pattern they can actually read and act on. If you're still logging in a sheet, our trading journal template shows the columns a calendar needs.
A cumulative P&L chart shows the shape of your equity curve, but it hides the day-level structure behind that shape. A month that ends up €2,000 looks identical on a line chart whether you earned it across fifteen steady green days or one lucky €3,500 Thursday surrounded by red. The calendar separates those two stories immediately, because the daily boxes and their colors are the data itself rather than a smoothed summary of it. It also anchors results to the real calendar, so weekday effects become obvious: many traders discover that Fridays or the first day after a big win are consistently red, something a chart indexed by trade number cannot reveal. Charts are still useful for judging overall drawdown and slope, but for reviewing behavior, spotting streaks, and checking consistency, the calendar is the faster and more honest view. Most traders use both, in that order.
Yes. GridTrade's calendar has a view switch that flips every daily box, weekly total, and monthly sum between currency, R-multiple, and percentage of account. R-multiple is the most useful of the three for reviewing execution, because it normalizes each day by the risk you actually took: a +2R day on a small account and a +2R day on a funded 100k account represent the same quality of trading even though the dollar figures differ by a factor of ten. That makes the R view the right one for comparing months in which your position size changed, or for judging a challenge account against a personal account side by side. The percentage view does the same job for traders who think in account growth, and the currency view stays there for the practical question of what you actually made. Read what R-multiple is if the concept is new.
Most prop firms apply some form of consistency rule during a challenge or funded phase: no single day may account for more than a fixed share of total profit, often 30 to 50 percent, and a daily loss limit caps how much you may lose before the account is breached. Both rules are day-based, which is exactly the unit a P&L calendar is built on. When you look at a month of green and red boxes, an outlier day that would violate the consistency rule stands out as the single box that is far darker than its neighbors, and you can compare it against the monthly total before the firm does. On the loss side, the red boxes show how close each bad day came to the daily limit, so a cluster of near-misses becomes a warning instead of a surprise. GridTrade does not enforce these rules — the firm's platform does — but the calendar makes them visible early enough to adjust. See the funded account journal for the multi-account side.
Yes, and this is where a calendar stops being a pretty summary and becomes an analysis tool. In GridTrade you can filter the calendar by trading account, so a funded account, a challenge account, and a personal brokerage account each get their own month view, or you can combine them for a total. You can filter by setup, which turns the calendar into a per-strategy report showing which days a specific playbook entry made or lost money. And you can filter by the 1-5 emotion score you log on every trade, which is often the most revealing view of all: showing only your emotion-4-and-above days frequently produces a calendar that is almost entirely red, while the emotion-1-to-2 days are steady green. Clicking any day opens the trades behind it, so you move from the pattern to the individual decisions in one step. See how to track emotions in trading for the scoring method.
Legal & Trademark Notice
Trademarks: Prop-firm names, broker names and trading-journal product names mentioned on this page are trademarks of their respective owners. GridTrade is not affiliated with, endorsed by, sponsored by, or in any way officially connected to any of these companies. References are made under the right of comparative advertising (German UWG § 6 / EU Directive 2006/114/EC) to describe compatibility with their publicly known rules.
Disclaimer: GridTrade is a journal/analytics tool. It does not provide trading signals, financial advice, or guarantees of success in any prop firm program. Trading carries substantial risk. Consistency-rule and daily-loss-limit figures on this page are illustrative; always verify current rules on the respective firm's official website before relying on them.
Last reviewed: 2026-09-06. · Operated by Fabian Lehmann (see Impressum).
See your month before your prop firm does.
14 days free, no credit card. €24.99/mo after, web + iOS, EU-hosted. The calendar is in the base tier.
Continue reading
Related guides and pages — same niche, different angle.