The trading journal template that actually works.
Most trading journal templates track prices and stop there. That's the half that tells you what happened, never why. This guide walks through the columns a journal actually needs — the hard data and the soft data — why each one earns its place, and the exact point where a static spreadsheet stops being enough.
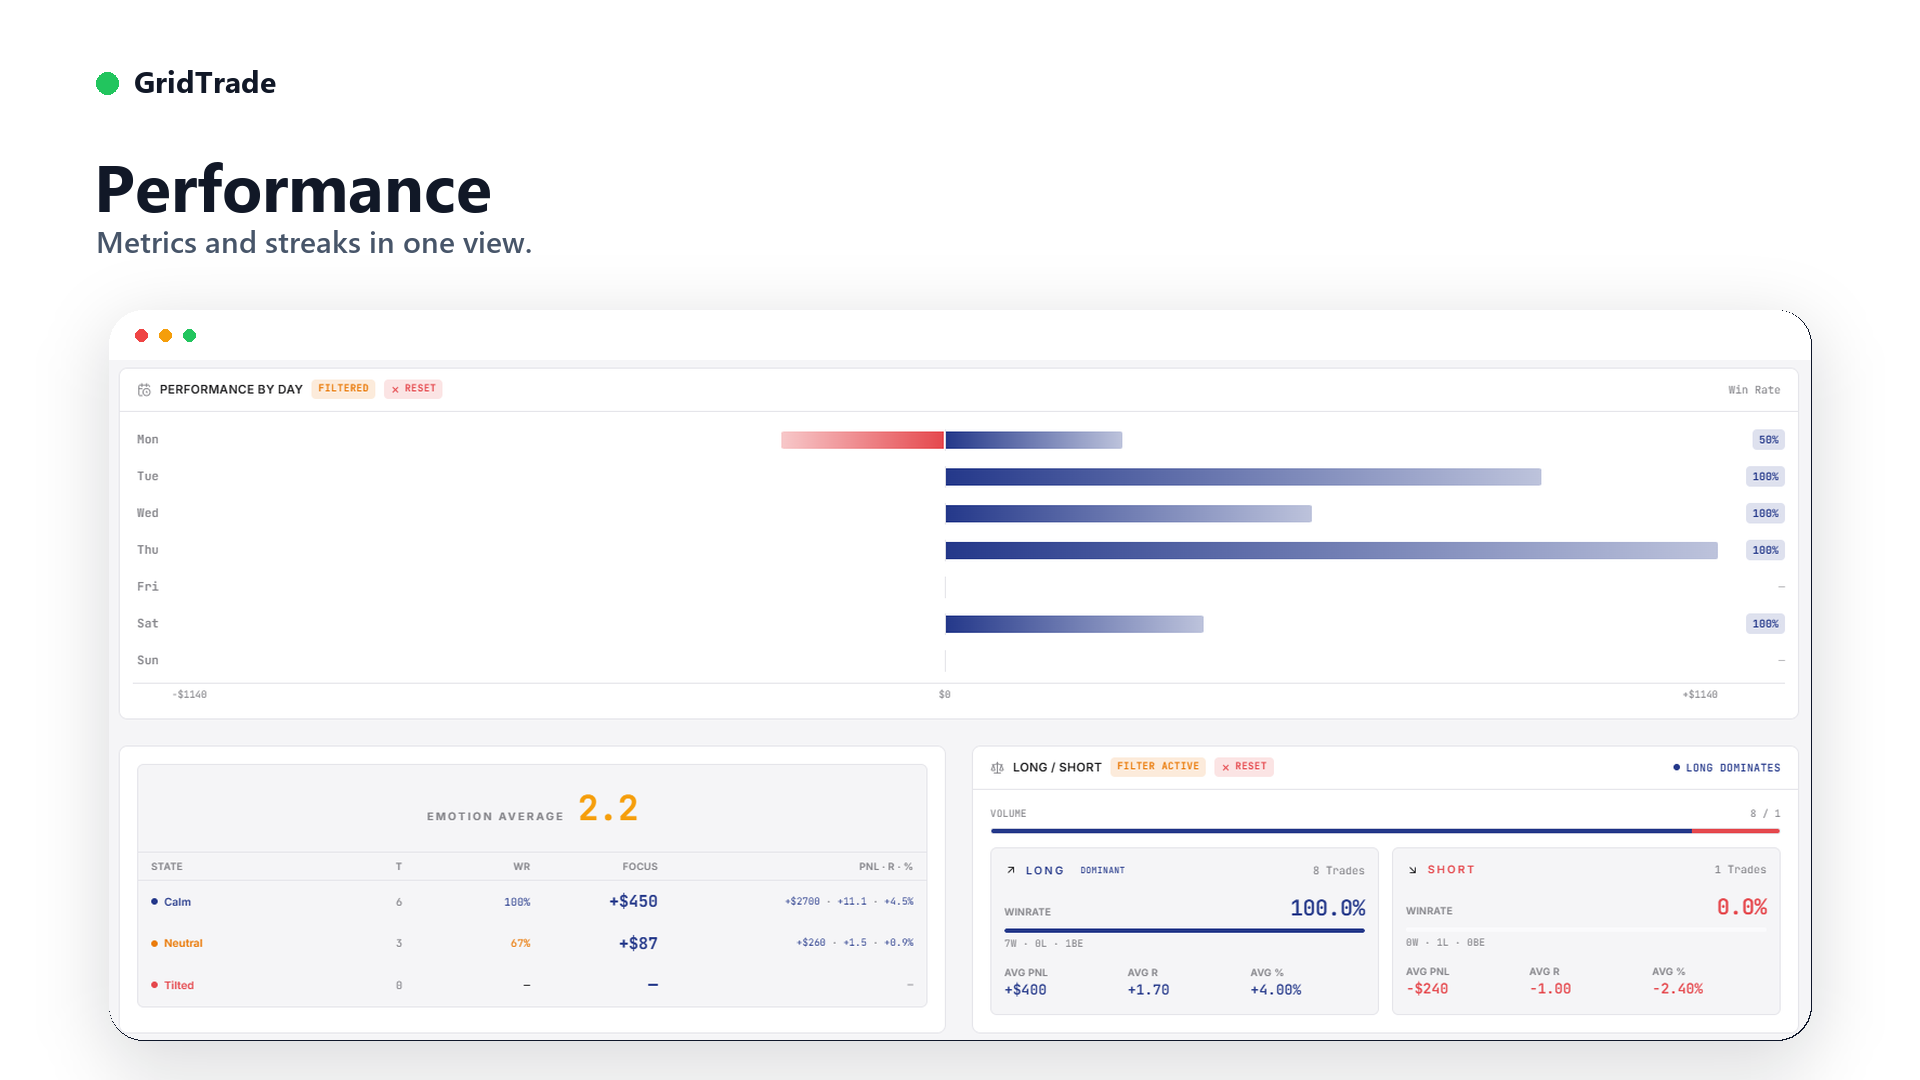
Why most templates only track half the trade
Download almost any free trading journal spreadsheet and you'll find the same columns: date, instrument, entry, exit, profit and loss. All of it is useful. None of it answers the only question that improves your trading — why did that trade happen the way it did?
A price-only log tells you that you lost 180 euros on NQ at 10:15. It can't tell you that you were revenge-trading after a red morning, that the setup wasn't in your playbook, or that you moved your stop. Those are the things you can actually fix. So a good template is split in two: the hard data that reconstructs the mechanics, and the soft data that captures the context and psychology behind it.
The hard data: what you objectively did
These fields are non-negotiable. They're objective, unarguable, and they're what every performance metric is computed from. Get sloppy here and your win rate, average R and expectancy are all garbage.
Lets you slice performance by day of week and by time of day. "I'm net negative in the first 15 minutes" is a common, fixable discovery.
London, New York, Asia, or the specific news window. Your edge is rarely uniform across sessions — most traders have one that quietly bleeds.
NQ, ES, EURUSD, gold. Lets you check whether you actually have an edge on every symbol you trade, or only one of them.
Many traders are far better in one direction. You won't know until you can filter long vs short win rate side by side.
The three prices that define the trade. Together they give you the planned risk and reward — and expose when you didn't set a stop at all.
Contracts, lots, or shares. The link between price movement and money, and the field where oversizing shows up when you cross-reference emotion.
What you actually put at risk relative to your account. The discipline field — consistent risk is what keeps a losing streak survivable.
Money pays the bills; R-multiple normalises every trade to the risk you took so you can compare a scalp and a swing on one scale.
The result-in-R column is the one people skip and shouldn't. Two 100-euro wins are not equal if one risked 50 and the other risked 400. R strips out size so you can see whether your edge is real. It's also what makes expectancy — your average R per trade — computable at all.
The soft data: context and psychology
This is where the real edge hides, and where most templates have nothing. These fields explain why the hard numbers came out the way they did. They feel subjective one trade at a time — in aggregate they're the sharpest diagnostic you own.
A tag from your playbook — "ORB", "failed breakout", "VWAP reclaim". Lets you rank your setups by expectancy and cut the ones that lose.
1 is calm and disciplined, 5 is fully activated by FOMO, revenge or euphoria. Filter for 4 and 5 and watch your win rate collapse.
From a fixed list you control: moved-stop, oversized, chased-entry, no-setup, or no-mistake. Three tags usually account for most of your red.
One image of the entry with your marks. Prices lie about what the chart looked like in the moment; a screenshot doesn't.
A single honest sentence written right after the trade — "took it out of boredom" — that a tag can never fully capture.
None of these are hard to fill in. The emotion score and mistake tag take three seconds each if you keep the lists short. The payoff comes when you stop reading them one trade at a time and start filtering them across a hundred — that's when the pattern in your losses becomes undeniable.
The recommended template columns
Here's the whole thing in one place. Copy it into a spreadsheet header row and you have a working trade log template today:
| Column | Group | Why it matters |
|---|---|---|
| Date & time | Hard | Slice by day and time of day |
| Session | Hard | Find the session that bleeds |
| Instrument / pair | Hard | Edge per symbol, not overall |
| Long / short | Hard | Directional skill is rarely equal |
| Entry price | Hard | Anchors the trade mechanics |
| Stop-loss | Hard | Defines planned risk; flags missing stops |
| Take-profit | Hard | Defines planned reward and R:R |
| Position size | Hard | Where oversizing becomes visible |
| Risk in % | Hard | The discipline field |
| Result in money | Hard | Pays the bills; keeps you honest |
| Result in R-multiple | Hard | Normalises for size; enables expectancy |
| Setup name | Soft | Rank and cut setups by expectancy |
| Emotion (1-5) | Soft | Exposes the psychological tax |
| Mistake tag | Soft | Three tags carry most of your red |
| Chart screenshot | Soft | Ground truth of the entry |
| One-line review note | Soft | The context a tag can't hold |
Where a static spreadsheet stops being enough
Let's be honest about the limits, because a spreadsheet template is genuinely where most traders should start. Building your own forces you to understand every column, and a handful of formulas will happily compute win rate, average R and expectancy across the whole sheet.
The wall you eventually hit isn't the math — it's filtering and cross-tabulation. The questions that actually change your trading are compound ones:
In a spreadsheet with a few hundred rows, answering that means pivot tables, helper columns, and manual rebuilding every single week. It's tedious enough that you stop asking — and a journal you never query is just an expensive diary. The insight lives in exactly the slices that are painful to cut.
That's the one real advantage of a purpose-built journal: it treats those columns as live fields, recomputes the math the moment you log a trade, and turns the compound question into a couple of clicks. You track the same hard and soft data — you just stop spending your review time maintaining the sheet instead of learning from it. Start with the spreadsheet; upgrade when the manual filtering starts costing you real time.
FAQ
What columns should a trading journal template have?
Split your template into hard data and soft data. The hard data is objective: date and time, session, instrument or pair, long or short, entry price, stop-loss, take-profit, position size, risk in percent, and the result in both money and R-multiple. These reconstruct exactly what you did and let you compute win rate, average R, and expectancy without guessing. The soft data is the context and psychology: the setup name, the emotion behind the trade rated 1-5, a mistake tag, a chart screenshot, and a one-line review note. That second half is where the real edge hides, because it explains why the hard numbers came out the way they did. A template with only prices tells you that you lost; a template with setup, emotion, and mistake tags tells you why you lost, which is the only thing you can actually fix and improve on.
Why log the result in R-multiple and not just money?
Money hides your real performance because every trade risks a different amount. A 200 euro win on a trade where you risked 400 is worse than a 100 euro win where you risked 50, but the raw money column ranks them the wrong way round. R-multiple fixes this by expressing every result as a multiple of the risk you took: risk one unit, and a win that returns twice your risk is plus-two R regardless of account size or contract count. That normalisation lets you compare a scalp on NQ against a swing on EURUSD on the same scale, and it makes expectancy computable as average R per trade. Keep the money column too, because it pays the bills and keeps you honest about drawdown. But R is the column that tells you whether your edge is actually real or whether you just sized up on the lucky ones.
Should I include emotion and mistake tags in the template?
Yes, and they are the most under-used columns in most templates. Rate the emotion behind each trade on a simple 1-5 scale, where 1 is calm and disciplined and 5 is fully activated by FOMO, revenge, or euphoria. Add a short mistake tag from a fixed list you control, such as moved-stop, oversized, chased-entry, or no-mistake. On their own these feel soft and subjective. In aggregate they become the sharpest diagnostic you own: filter for emotion four and five and the win rate usually collapses, and the same three mistake tags tend to account for most of your red. That is not a strategy problem, it is a behaviour problem, and you cannot see it from prices alone. A one-line review note per trade adds the human context a tag cannot capture. Together they turn a dry price log into an actual coaching tool for yourself.
Is a spreadsheet trading journal template good enough?
A spreadsheet is a genuinely good place to start, and building your own forces you to understand every field you track. The math is manageable too, since a few formulas will give you win rate, average R, and expectancy across the whole sheet. Where a static template quietly falls apart is filtering and cross-tabulation. The questions that actually change your trading are things like the win rate at emotion four or higher on NQ specifically on Tuesdays, and answering that in a spreadsheet with hundreds of rows means pivot tables, helper columns, and manual work every single week. If slicing the data is painful you stop doing it, and a journal you never query is just an expensive diary. The habit still matters more than the tool, so start with the spreadsheet. Move to something purpose-built once the manual filtering starts costing you real time each week.
How is a purpose-built journal different from a template?
A template is a blank structure you fill in and maintain by hand, whereas a purpose-built journal treats those same columns as live fields and does the work around them for you. The math is the obvious part: win rate, average R, expectancy, and drawdown recompute automatically the moment you log a trade, so there are no formulas to drag down or break when you insert a row. The bigger difference is filtering. Instead of building a pivot table, you click emotion, instrument, session, and setup, and the stats update instantly for that exact slice. That makes questions like your expectancy on one setup after a losing day cheap enough to ask every week, which is when patterns actually surface. You still track the same hard and soft data as a good template. You just stop spending your review time maintaining the sheet instead of learning from it.
A journal that does the filtering for you.
GridTrade ships every column in this guide as a native field — hard data and soft data — and recomputes win rate, R-multiple and expectancy for any slice you click. The compound questions become one tap. €24.99/mo flat. 14-day free trial, no credit card.
Start free trial