Drawdown recovery: the math, the psychology, and the playbook.
Drawdown recovery is the process of bringing a trading account back to its previous equity high after a losing period. Because gains are measured on a smaller base, every drawdown needs a larger percentage gain to recover than was lost — a 20% drawdown needs 25%, a 50% drawdown needs 100%. Recovery is a process problem first and a P&L problem second.
The math: why losses need a bigger gain to recover
Most traders intuitively feel that a 20% loss needs a 20% win to fix. It doesn't. A €10,000 account that drops 20% is at €8,000. To get back to €10,000 you need €2,000 — and €2,000 is 25% of €8,000, not 20%. The gain is measured on the smaller base, so the climb is always steeper than the fall.
The formula is simple: gain needed = drawdown / (1 − drawdown). The table below is the "drawdown recovery calculator" most people are looking for — it's arithmetic, so you don't need a tool, you need to look at the right-hand column once and remember it.
| Drawdown | Gain needed to break even | €10,000 account example |
|---|---|---|
| 5% | 5.3% | €9,500 → needs +€500 |
| 10% | 11.1% | €9,000 → needs +€1,000 |
| 15% | 17.6% | €8,500 → needs +€1,500 |
| 20% | 25.0% | €8,000 → needs +€2,000 |
| 25% | 33.3% | €7,500 → needs +€2,500 |
| 30% | 42.9% | €7,000 → needs +€3,000 |
| 40% | 66.7% | €6,000 → needs +€4,000 |
| 50% | 100% | €5,000 → needs +€5,000 |
Notice the curve. Up to about 15% the gap is annoying but survivable — a normal edge delivers 11% or 17% in a reasonable number of trades. Past 25% the gain required starts exceeding anything most traders have ever produced in a single stretch, and past 40% you're being asked for a career-best run at the exact moment you're least equipped to deliver one. That's why drawdown management is mostly about keeping the number in the top half of that table, and why the rest of this guide is about process, not P&L.
Why drawdowns become fatal (it's not the first loss)
Almost no account is blown by the initial drawdown. A 10% losing streak at fixed size is a statistical certainty over a long enough sample — every profitable strategy has one. What kills accounts is what the trader does in response to it. Three moves, in roughly this order:
Doubling size to recover in half the trades. It also doubles every loser, and losers are more likely right now — a 10% hole becomes 20% in two trades, and the required gain jumps from 11% to 25%.
"It'll come back" turns a planned 1R loss into a 3R loss. One moved stop can undo a week of disciplined trades and is the classic way a mild drawdown becomes a deep one.
New setups, new timeframes, new markets — anything that promises a faster way out. Your untested ideas now carry your damaged account, and they don't have an edge.
Each of these is a psychological response to the pain of being down, and they compound: the moved stop deepens the hole, the deeper hole justifies bigger size, bigger size makes the next loss unbearable, and the unbearable loss triggers the off-plan trade. That spiral is the actual enemy. If you recognise it, read how to stop revenge trading — it's the same mechanism with a different name.
The prop-firm angle: rule distance, not P&L
In a personal account a drawdown is a setback. In a funded account it's a countdown. Max drawdown, trailing drawdown, and daily loss limits mean a drawdown you could comfortably recover from on your own money simply ends the account — there is no "I'll grind it back over three months," because you'll have breached the floor long before month one is over.
This changes the first question. On a personal account you ask "how much did I lose?". On a funded account you ask "how far am I from the rule?" — and the answer is often much smaller than the P&L suggests, especially under a trailing drawdown that has already ratcheted the floor up behind your best day.
Example: drawdown vs rule distance
$100,000 funded account, 8% trailing max drawdown, 1% risk per trade.
- Week 1: you run it up to $103,000. The floor trails to $95,000.
- Week 2: a losing streak takes you down to $98,000.
P&L view: drawdown from high is 4.9%. Needs a 5.1% gain to recover. Mild — a personal account shrugs this off.
Rule-distance view: you're $3,000 above the floor. That's three normal losers at 1% risk. The account is one bad morning from termination.
Same trader, same equity, completely different situation. Recovery on a funded account starts by cutting risk so that a normal losing streak cannot touch the floor — typically a quarter to a third of the remaining cushion per trade — and only then thinking about the P&L. Our funded account journal guide covers tracking rule distance per account, and if you're still in evaluation, how to pass a prop firm challenge explains why passing is mostly not-breaching.
The recovery playbook
Six steps, in order. The sequence matters: measuring before cutting, cutting before rebuilding. Skipping ahead to "rebuild" is the spiral in disguise.
- Stop and measure. No trades until you have three numbers: the size of the drawdown (peak to current, in % and R), the distance to any rule (daily limit, max or trailing drawdown), and the emotion rating on the losing trades. If the losers were calm, rule-following 3s and below, this is variance. If they're 4s and 5s, this is the spiral and the fix is different.
- Cut size to half or less — until N clean trades. Pick a number (ten or twenty consecutive rule-following trades is typical) and don't return to full size until you've hit it. The point isn't to earn less; it's to make the next loser survivable while you prove the process is intact. Use a risk calculator to set the reduced size precisely rather than eyeballing it.
- Go back to your best setup only. Your journal shows which setup has the highest expectancy over the largest sample. Trade that and nothing else. Drawdowns are where traders "try things," and untested ideas are exactly what your damaged account cannot afford.
- Set a hard daily loss cap. Two losers, or 1.5% of the account, or whatever fits your rule distance — then the platform closes. A drawdown is recovered one green day at a time, and a single uncapped red day can undo a month of them.
- Rebuild by process metrics, not P&L. For the recovery period, your scoreboard is rule adherence (target: 100%) and average emotion rating (target: ≤3). P&L follows those two with a lag; chasing it directly is how the spiral restarts. Track R-multiple per trade, not money.
- Know when to walk away for the day — or the week. Two rule breaks in a session, an emotion-5 trade, or hitting the daily cap all end the day. Three red days in a row at reduced size end the week. Time off during a drawdown is not lost opportunity; it's the cheapest recovery tool you have.
What recovery actually looks like in the journal
The equity curve is the last thing to recover, so if you watch only that, you'll conclude nothing is working for weeks. What moves first is the process data: emotion ratings drift back down to 2s, rule adherence hits 100% for a stretch, average loss shrinks back to 1R because stops stop moving. Then the win rate on your best setup normalises, then expectancy turns positive again, and then the curve turns.
That order is worth internalising, because it's the opposite of how it feels. Our trading psychology statistics page collects what the research says about drawdown behaviour, and a P&L calendar makes the "one green day at a time" rhythm visible — a row of small greens after a red cluster is what recovery looks like from above.
Common objections
- "Cutting size means it takes forever to recover." Slower on paper, faster in practice. Full-size traders in a drawdown routinely deepen it before they recover; half-size traders rarely do. The trader who takes twelve weeks and gets there beats the one who plans on four and blows up in the third.
- "My edge is fine, this is just variance." Maybe — and the journal will tell you. If the losing trades were calm, in-plan, fixed-size 1R stops, it's variance and you keep going at reduced size. If any of them involved a moved stop or a 4+ emotion, it wasn't variance, and the "edge is fine" story is the spiral talking.
- "I'll just take a break and come back fresh." A break is step six, not a substitute for steps one to five. Come back without having measured the drawdown and cut size, and you'll resume the same behaviour with a fresh dose of "I need to make up for lost time."
- "The prop firm floor is too close, I have to size up to have a chance." Sizing up next to the floor doesn't give you a chance, it gives you a coin flip on the account. If the cushion genuinely can't absorb a normal losing streak at any sensible size, the honest move is to accept the account may be lost and protect the next one — not to gamble this one.
FAQ
How much gain do I need to recover a 20% drawdown?
A 20% drawdown needs a 25% gain to get back to break even, not 20%. The reason is that the gain is measured on a smaller base. If a 10,000 account falls to 8,000, you have lost 2,000 — but 2,000 is 25% of the 8,000 you now hold. The general formula is gain needed = drawdown / (1 − drawdown), so 0.20 / 0.80 = 0.25. The gap widens fast as the drawdown grows: 30% needs 42.9%, 40% needs 66.7%, and 50% needs a full 100%. This asymmetry is the whole argument for keeping drawdowns small in the first place. A trader who caps losses at 10% only ever needs 11.1% to recover, which a normal edge can deliver in a reasonable number of trades. A trader who lets it run to 40% needs a performance they have probably never produced, and the pressure to produce it is exactly what fuels the next mistake.
What is the difference between max drawdown and trailing drawdown?
Max drawdown, sometimes called static or absolute drawdown, is a fixed floor measured from your starting balance. On a 100,000 account with a 10% max drawdown, the account is breached if equity ever touches 90,000, regardless of how high it went before. Trailing drawdown moves the floor up as you make money. The same 10% rule trails your highest balance, so if you run the account up to 106,000, the floor rises to 96,000 and stays there even if you give the profit back. Some firms trail on closed balance only, others on intraday unrealized equity, which is stricter because an open winner that reverses can raise the floor without ever paying you. Many programs stop trailing once the floor reaches the starting balance. For recovery this matters enormously: under a trailing rule your usable cushion can be far smaller than the P&L suggests, so always calculate the distance to the floor, not the distance to zero.
Should I increase position size to recover a drawdown faster?
No. Increasing size in a drawdown is the single most reliable way to turn a recoverable loss into a fatal one. The math looks tempting: double the size and you halve the number of winners you need. But you also double the damage of every loser, and losers are statistically more likely right now because the same conditions or the same mistakes that produced the drawdown are usually still present. A 10% drawdown at normal size becomes 20% after two oversized losses, and 20% needs 25% to recover instead of 11%. You have made the hole deeper and the required climb steeper in the same move. Emotionally, oversizing also means every trade carries more pressure, which degrades execution further. The disciplined answer is the opposite: cut size to half or less, prove you can follow the rules for a string of trades, and only return to full size when the process metrics are back to normal.
How long does drawdown recovery take?
It depends on the depth of the drawdown, your expectancy per trade, and how many trades you take — and, critically, whether you keep adding to the hole while trying to climb out. A rough estimate divides the gain you need by your average expectancy per trade. If you need 11.1% to recover a 10% drawdown, your average risk is 1% per trade, and your expectancy is 0.2R, then you need roughly 55 trades at full size, or more at reduced size. That is weeks to months for most day traders, not days. The number matters less than the direction: a trader who cuts size, returns to their best setup, and measures rule adherence usually recovers slower on paper but actually gets there, while a trader who chases the P&L target recovers faster in fantasy and blows up in practice. Set the timeline by trades, not by calendar, and stop counting money until the process is clean.
How do prop firm drawdown rules change recovery?
In a personal account a drawdown is a setback you can recover from at any pace you like. In a funded account it is a countdown, because max drawdown and daily loss limits end the account before you have a chance to recover. That changes the first question from "how much did I lose" to "how far am I from the rule". A 6% drawdown against an 8% limit leaves 2% of room, which at 1% risk per trade is two normal losers. Recovery under those conditions cannot be a P&L project; it has to be a rule-distance project. Cut risk so that a normal losing streak cannot breach the floor, ideally to a quarter or a third of the remaining cushion per trade. Accept that rebuilding will be slow. The alternative, trading full size two losers from termination, is how most funded accounts actually end — not in one disaster, but in a recovery attempt.
See your drawdown, expectancy and rule distance in one place.
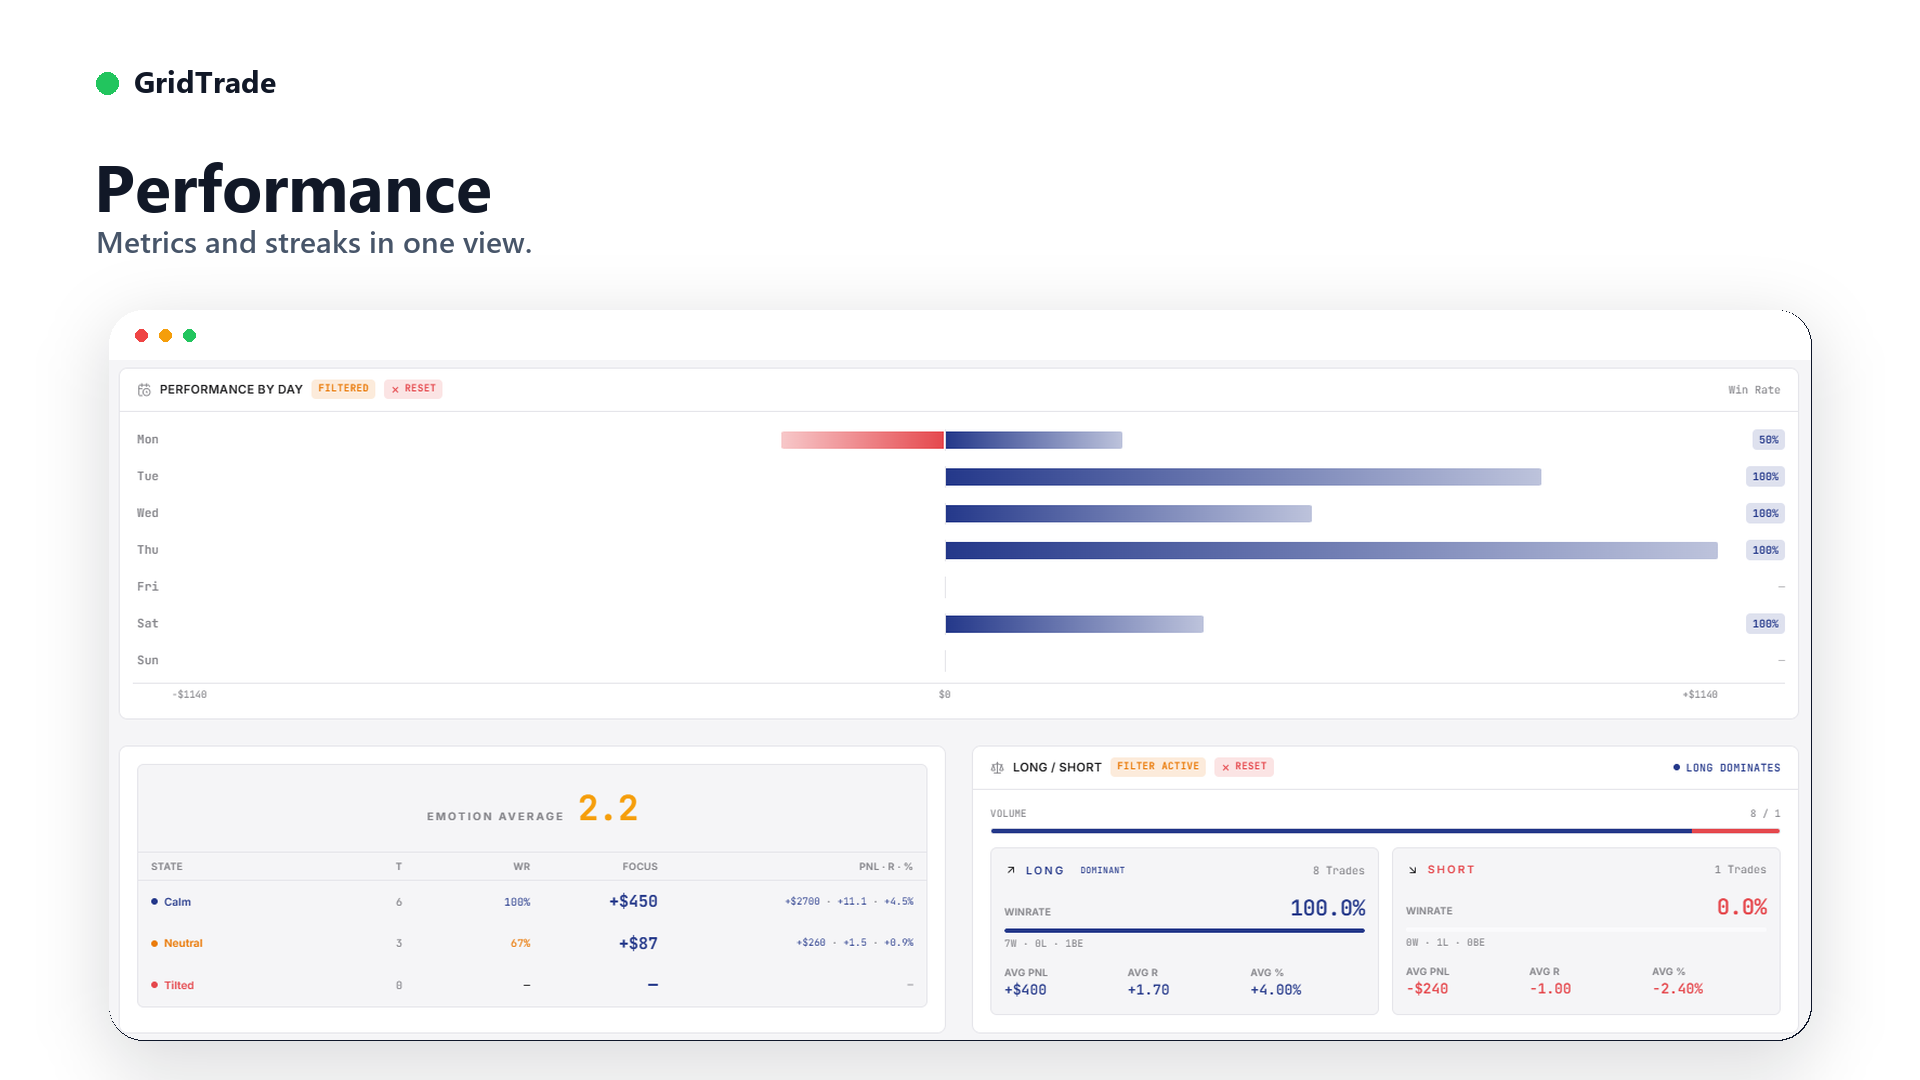
GridTrade tracks drawdown per account, R-multiple and expectancy per setup, and emotion 1-5 per trade — so "am I recovering?" is a number, not a feeling. €24.99/mo flat. 14-day free trial, no credit card.
Start free trial